Top Rankings
Chesterfield County School District ranks among the top 20% of public school district in Virginia for:
Category
Attribute
Diversity
Most diverse schools (Top 1%)
Community Size
Largest student body (number of students) (Top 1%)
For the 2025 school year, there are 41 public preschools serving 28,685 students in Chesterfield County School District. This district's average pre testing ranking is 5/10, which is in the bottom 50% of public pre schools in Virginia.
ÎÛÎÛÂþ» Preschools in Chesterfield County School District have an average math proficiency score of 53% (versus the Virginia public pre school average of 55%), and reading proficiency score of 63% (versus the 66% statewide average).
Minority enrollment is 57% of the student body (majority Black and Hispanic), which is more than the Virginia public preschool average of 56% (majority Hispanic and Black).
Overview
This School District
This State (VA)
# Schools
73 Schools
1,059 Schools
# Students
64,132 Students
522,218 Students
# Teachers
4,611 Teachers
37,218 Teachers
Student : Teacher Ratio
14:1
14:1
District Rank
Chesterfield County School District, which is ranked within the bottom 50% of all 135 school districts in Virginia (based off of combined math and reading proficiency testing data) for the 2020-2021 school year.
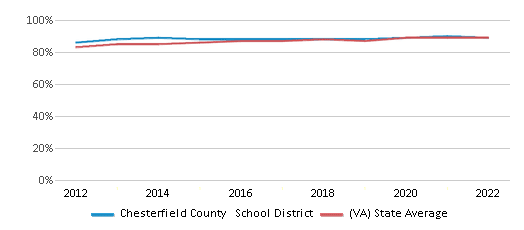
The school district's graduation rate of 89% has increased from 88% over five school years.
Overall District Rank
#68 out of 135 school districts
(Bottom 50%)
(Bottom 50%)
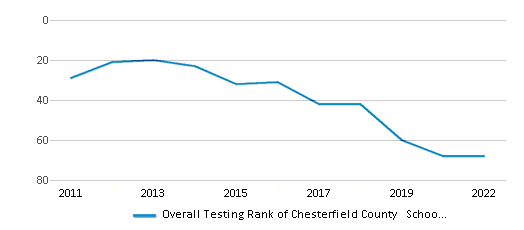
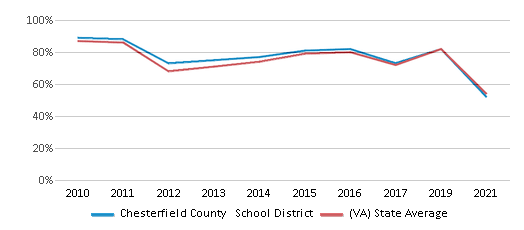
Math Test Scores (% Proficient)
(20-21)52%
54%
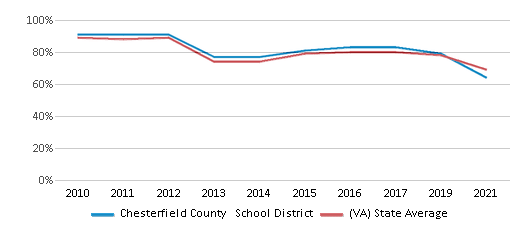
Reading/Language Arts Test Scores (% Proficient)
(20-21)64%
69%
Science Test Scores (% Proficient)
(20-21)63%
59%
Graduation Rate
89%
89%
Students by Ethnicity:
Diversity Score
0.70
0.72
# American Indian Students
114 Students
1,435 Students
% American Indian Students
n/a
n/a
# Asian Students
2,132 Students
42,355 Students
% Asian Students
3%
8%
# Hispanic Students
13,765 Students
104,836 Students
% Hispanic Students
22%
20%
# Black Students
16,882 Students
103,630 Students
% Black Students
26%
20%
# White Students
27,491 Students
231,144 Students
% White Students
43%
44%
# Hawaiian Students
116 Students
693 Students
% Hawaiian Students
n/a
n/a
# Two or more races Students
3,632 Students
38,125 Students
% of Two or more races Students
6%
8%
Students by Grade:
# Students in PK Grade:
943
34,291
# Students in K Grade:
4,361
76,338
# Students in 1st Grade:
4,636
80,198
# Students in 2nd Grade:
4,813
82,775
# Students in 3rd Grade:
4,622
74,941
# Students in 4th Grade:
4,695
76,158
# Students in 5th Grade:
4,880
74,304
# Students in 6th Grade:
4,603
13,434
# Students in 7th Grade:
4,882
1,615
# Students in 8th Grade:
4,959
653
# Students in 9th Grade:
5,606
1,849
# Students in 10th Grade:
5,317
1,917
# Students in 11th Grade:
4,928
1,904
# Students in 12th Grade:
4,887
1,841
# Ungraded Students:
-
-
District Revenue and Spending
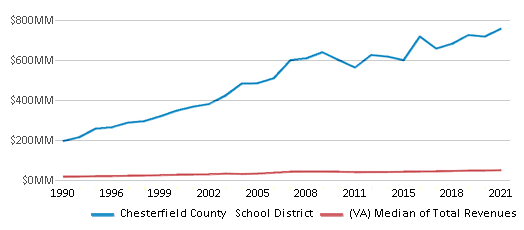
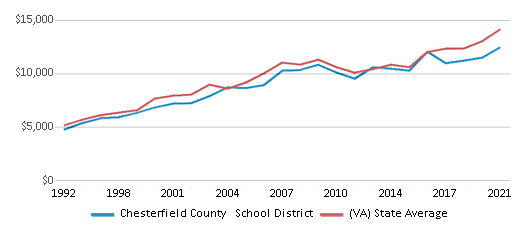
The revenue/student of $11,804 in this school district is less than the state median of $15,502. The school district revenue/student has declined by 5% over four school years.
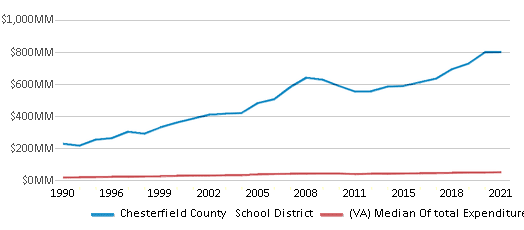
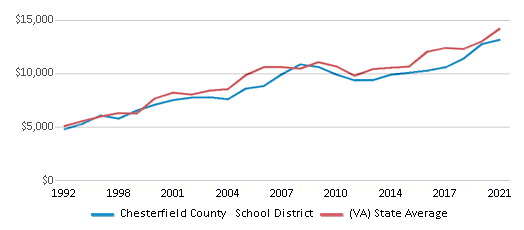
The school district's spending/student of $12,483 is less than the state median of $15,257. The school district spending/student has declined by 5% over four school years.
Total Revenue
$757 MM
$19,496 MM
Spending
$801 MM
$19,187 MM
Revenue / Student
$11,804
$15,502
Spending / Student
$12,483
$15,257
Best Chesterfield County School District ÎÛÎÛÂþ» Preschools (2025)
School
(Math and Reading Proficiency)
(Math and Reading Proficiency)
Location
Grades
Students
Rank: #11.
Greenfield Elementary School
(Math: 92% | Reading: 93%)
Rank:
Rank:
10/
Top 1%10
10751 Savoy Rd.
Richmond, VA 23235
(804) 560-2720
Richmond, VA 23235
(804) 560-2720
Grades: PK-5
| 485 students
Rank: #22.
Alberta Smith Elementary School
(Math: 85-89% | Reading: 85-89%)
Rank:
Rank:
10/
Top 5%10
13200 Bailey Bridge Rd
Midlothian, VA 23112
(804) 739-6295
Midlothian, VA 23112
(804) 739-6295
Grades: PK-5
| 675 students
Rank: #33.
Bettie Weaver Elementary School
(Math: 81% | Reading: 91%)
Rank:
Rank:
10/
Top 5%10
3600 James River Rd
Midlothian, VA 23113
(804) 378-2540
Midlothian, VA 23113
(804) 378-2540
Grades: PK-5
| 613 students
Rank: #44.
Woolridge Elementary School
(Math: 81% | Reading: 85%)
Rank:
Rank:
10/
Top 10%10
5401 Timber Bluff Pkwy.
Midlothian, VA 23112
(804) 739-6330
Midlothian, VA 23112
(804) 739-6330
Grades: PK-5
| 798 students
Rank: #55.
J.b. Watkins Elementary School
(Math: 80% | Reading: 84%)
Rank:
Rank:
9/
Top 20%10
501 Coalfield Rd.
Midlothian, VA 23114
(804) 378-2530
Midlothian, VA 23114
(804) 378-2530
Grades: PK-5
| 831 students
Rank: #66.
Winterpock Elementary School
(Math: 78% | Reading: 83%)
Rank:
Rank:
9/
Top 20%10
9000 Elementary Way Loop
Chesterfield, VA 23832
(804) 763-5051
Chesterfield, VA 23832
(804) 763-5051
Grades: PK-5
| 798 students
Rank: #77.
Old Hundred Elementary School
(Math: 75% | Reading: 81%)
Rank:
Rank:
9/
Top 20%10
1501 Old Hundred Road
Midlothian, VA 23114
(804) 748-1405
Midlothian, VA 23114
(804) 748-1405
Grades: PK-5
| 972 students
Rank: #88.
W.w. Gordon Elementary School
(Math: 66% | Reading: 72%)
Rank:
Rank:
7/
Top 50%10
11701 Gordon School Rd.
Richmond, VA 23236
(804) 378-2410
Richmond, VA 23236
(804) 378-2410
Grades: PK-5
| 609 students
Rank: #99.
Spring Run Elementary School
(Math: 65% | Reading: 68%)
Rank:
Rank:
6/
Top 50%10
13901 Spring Run Rd
Midlothian, VA 23112
(804) 639-6352
Midlothian, VA 23112
(804) 639-6352
Grades: PK-5
| 866 students
Rank: #1010.
Swift Creek Elementary School
(Math: 60-64% | Reading: 65-69%)
Rank:
Rank:
6/
Top 50%10
13800 Genito Rd.
Midlothian, VA 23112
(804) 739-6305
Midlothian, VA 23112
(804) 739-6305
Grades: PK-5
| 737 students
Rank: #1111.
Grange Hall Elementary School
(Math: 58% | Reading: 69%)
Rank:
Rank:
6/
Top 50%10
19301 Hull Street Rd.
Moseley, VA 23120
(804) 739-6265
Moseley, VA 23120
(804) 739-6265
Grades: PK-5
| 748 students
Rank: #1212.
Clover Hill Elementary School
(Math: 57% | Reading: 69%)
Rank:
Rank:
6/
Top 50%10
5700 Woodlake Village Pkwy
Midlothian, VA 23112
(804) 739-6220
Midlothian, VA 23112
(804) 739-6220
Grades: PK-5
| 877 students
Rank: #1313.
Evergreen Elementary School
(Math: 60% | Reading: 64%)
Rank:
Rank:
5/
Bottom 50%10
1701 Evergreen East Pkwy.
Midlothian, VA 23114
(804) 378-2400
Midlothian, VA 23114
(804) 378-2400
Grades: PK-5
| 823 students
Rank: #1414.
Robious Elementary School
(Math: 54% | Reading: 68%)
Rank:
Rank:
5/
Bottom 50%10
2801 Robious Crossing Dr.
Midlothian, VA 23113
(804) 378-2500
Midlothian, VA 23113
(804) 378-2500
Grades: PK-5
| 677 students
Rank: #1515.
Enon Elementary School
(Math: 53% | Reading: 67%)
Rank:
Rank:
5/
Bottom 50%10
2001 E. Hundred Rd.
Chester, VA 23836
(804) 530-5720
Chester, VA 23836
(804) 530-5720
Grades: PK-5
| 796 students
Rank: #1616.
O.b. Gates Elementary School
(Math: 55-59% | Reading: 64%)
Rank:
Rank:
5/
Bottom 50%10
10001 Courthouse Rd.
Chesterfield, VA 23832
(804) 768-6195
Chesterfield, VA 23832
(804) 768-6195
Grades: PK-5
| 617 students
Rank: #1717.
Marguerite F. Christian Elementary School
(Math: 55-59% | Reading: 60-64%)
Rank:
Rank:
5/
Bottom 50%10
14801 Woods Edge Rd.
Colonial Heights, VA 23834
(804) 530-5733
Colonial Heights, VA 23834
(804) 530-5733
Grades: PK-5
| 590 students
Rank: #1818.
Bon Air Elementary School
(Math: 61% | Reading: 60%)
Rank:
Rank:
5/
Bottom 50%10
8701 Polk St
Richmond, VA 23235
(804) 560-2700
Richmond, VA 23235
(804) 560-2700
Grades: PK-5
| 526 students
Rank: #1919.
J.g. Hening Elementary School
(Math: 48% | Reading: 62%)
Rank:
Rank:
4/
Bottom 50%10
5230 Chicora Dr.
Richmond, VA 23234
(804) 743-3655
Richmond, VA 23234
(804) 743-3655
Grades: PK-5
| 877 students
Rank: #2020.
Jacobs Road Elementary School
(Math: 50-54% | Reading: 55-59%)
Rank:
Rank:
4/
Bottom 50%10
8800 Jacobs Rd.
Chesterfield, VA 23832
(804) 674-1320
Chesterfield, VA 23832
(804) 674-1320
Grades: PK-5
| 742 students
Rank: #2121.
Elizabeth Scott Elementary School
(Math: 56% | Reading: 56%)
Rank:
Rank:
4/
Bottom 50%10
813 Beginners Trail Loop
Chester, VA 23836
(804) 541-4660
Chester, VA 23836
(804) 541-4660
Grades: PK-5
| 757 students
Rank: #2222.
Harrowgate Elementary School
(Math: 40-44% | Reading: 60-64%)
Rank:
Rank:
4/
Bottom 50%10
4000 Cougar Trail
Chester, VA 23831
(804) 520-6015
Chester, VA 23831
(804) 520-6015
Grades: PK-5
| 473 students
Rank: #2323.
Providence Elementary School
(Math: 45-49% | Reading: 55-59%)
Rank:
Rank:
4/
Bottom 50%10
11001 W. Providence Rd.
Richmond, VA 23236
(804) 674-1345
Richmond, VA 23236
(804) 674-1345
Grades: PK-5
| 641 students
Rank: #2424.
Ecoff Elementary School
(Math: 35-39% | Reading: 60-64%)
Rank:
Rank:
3/
Bottom 50%10
5200 Ecoff Ave.
Chester, VA 23831
(804) 768-6185
Chester, VA 23831
(804) 768-6185
Grades: PK-5
| 757 students
Rank: #2525.
Thelma Crenshaw Elementary School
(Math: 40% | Reading: 57%)
Rank:
Rank:
3/
Bottom 50%10
11901 Bailey Bridge Rd.
Midlothian, VA 23112
(804) 739-6250
Midlothian, VA 23112
(804) 739-6250
Grades: PK-5
| 660 students
Rank: #2626.
C.c. Wells Elementary School
(Math: 35-39% | Reading: 55-59%)
Rank:
Rank:
3/
Bottom 50%10
13101 S. Chester Rd.
Chester, VA 23831
(804) 768-6265
Chester, VA 23831
(804) 768-6265
Grades: PK-5
| 582 students
Rank: #2727.
Crestwood Elementary School
(Math: 40-44% | Reading: 45-49%)
Rank:
Rank:
2/
Bottom 50%10
7600 Whittington Dr.
Richmond, VA 23225
(804) 560-2710
Richmond, VA 23225
(804) 560-2710
Grades: PK-5
| 600 students
Rank: #2828.
Matoaca Elementary School
(Math: 35-39% | Reading: 52%)
Rank:
Rank:
2/
Bottom 50%10
6627 River Rd
Petersburg, VA 23803
(804) 590-3100
Petersburg, VA 23803
(804) 590-3100
Grades: PK-5
| 636 students
Rank: #2929.
Salem Church Elementary School
(Math: 35-39% | Reading: 45-49%)
Rank:
Rank:
2/
Bottom 50%10
9600 Salem Church Rd.
Richmond, VA 23237
(804) 768-6215
Richmond, VA 23237
(804) 768-6215
Grades: PK-5
| 510 students
Rank: #30 - 3230. - 32.
Ettrick Elementary School
(Math: 30-34% | Reading: 45-49%)
Rank:
Rank:
2/
Bottom 50%10
20910 Chesterfield Ave.
Petersburg, VA 23803
(804) 520-6005
Petersburg, VA 23803
(804) 520-6005
Grades: PK-5
| 514 students
Rank: #30 - 3230. - 32.
Hopkins Road Elementary School
(Math: 30-34% | Reading: 45-49%)
Rank:
Rank:
2/
Bottom 50%10
6000 Hopkins Rd.
Richmond, VA 23234
(804) 743-3665
Richmond, VA 23234
(804) 743-3665
Grades: PK-5
| 753 students
Rank: #30 - 3230. - 32.
Reams Road Elementary School
(Math: 30-34% | Reading: 45-49%)
Rank:
Rank:
2/
Bottom 50%10
10141 Reams Rd.
Richmond, VA 23236
(804) 674-1370
Richmond, VA 23236
(804) 674-1370
Grades: PK-5
| 609 students
Rank: #3333.
Beulah Elementary School
(Math: 30% | Reading: 49%)
Rank:
Rank:
2/
Bottom 50%10
5441 Beulah Rd
Richmond, VA 23237
(804) 743-3620
Richmond, VA 23237
(804) 743-3620
Grades: PK-5
| 993 students
Rank: #34 - 3534. - 35.
A.m. Davis Elementary School
(Math: 27% | Reading: 47%)
Rank:
Rank:
2/
Bottom 50%10
415 S Providence Rd
Richmond, VA 23236
(804) 674-1310
Richmond, VA 23236
(804) 674-1310
Grades: PK-5
| 737 students
Rank: #34 - 3534. - 35.
C.e. Curtis Elementary School
(Math: 25-29% | Reading: 45-49%)
Rank:
Rank:
2/
Bottom 50%10
3600 W Hundred Rd
Chester, VA 23831
(804) 768-6175
Chester, VA 23831
(804) 768-6175
Grades: PK-5
| 772 students
Show 6 more public schools in Chesterfield County School District (out of 41 total schools)
Loading...
Recent Articles

Year-Round Or Traditional Schedule?
Which is more appropriate for your child? A year-round attendance schedule or traditional schedule? We look at the pros and cons.

Why You Should Encourage Your Child to Join a Sports Team
Participating in team sports has a great many benefits for children, there is no doubt. In this article you will learn what those benefits are.

White Students are Now the Minority in U.S. ÎÛÎÛÂþ» Schools
Increasing birth rates among immigrant families from Asia and Central and South America, combined with lower birth rates among white families, means that for the first time in history, public school students in the United States are majority-minority. This shift in demographics poses difficulties for schools as they work to accommodate children of varying language abilities and socio-economic backgrounds.


